For evaluation of Fluoroscopy and CR / DR imaging systems
Most definitions of image quality in radiology are based on characterising the physical properties of the image chain. However, medical diagnosis is not made by the image alone. The perception by the observer is crucial for the result. A test of the observers perception is possible with so called Contrast-Detail (CD) phantoms. With a CD-phantom it is possible to quantify both, detail and contrast, as observed by the radiologist. The CD RAD 2.0 phantom can be used within the entire range of diagnostic imaging systems, such as fluoroscopy and digital subtraction angiography.
Construction
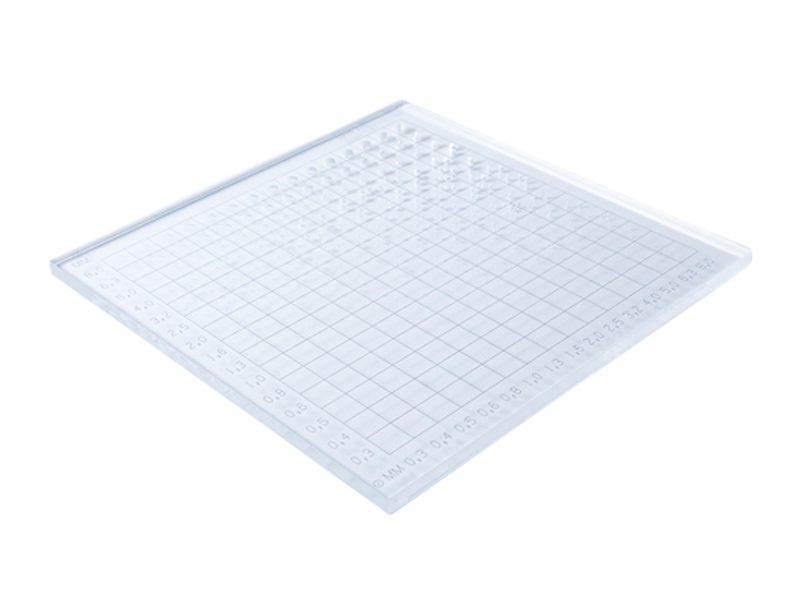
The CDRAD phantom consists of a Plexiglass tablet with cylindrical holes of exact diameter and depth (tolerances: 0.02 mm). Together with additional Plexiglass tablets, to simulate the dimensions of the patient, the radiographic image of the phantom gives information about the imaging performance of the whole system. The image shows 225 squares, 15 rows and 15 columns. In each square either one or two spots are present, being the images of the holes. The first three rows show only one spot, while the other rows have two identical spots, one in the middle and one in a randomly chosen corner. The optical densities of the spots are higher as compared to the uniform background. Due to the (exponentially) increasing depth of the holes in horizontal direction, the image shows the holes increases stepwise and exponentially from 0.3 mm to 8.0 mm. For the image this means 15 rows of spots with increasing spatial resolution.
- Consists of Plexiglas tablet with cylindrical holes of exact diameter and depth.
- The image shows 225 squares in which either 1 or 2 spots are present.
- Radiographic image gives information about the performance of the system.
- Tests Low Contrast detection and Spatial resolution.
CD RAD Analyser software - companion to the above CD RAD Phantom
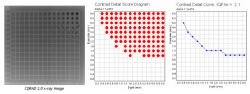
This program has the ability to score the images obtained with the CD RAD phantom automatically, provided a digital image is present. The program is easy to use and gives the user reports of the quality of the images obtained.
- Automatic scorin diagram and correction scheme.
- Image quality figure. Statistically sound.
- Excellent user friendly and time saving software.
- Reports the quality of the images.
Documents
Sorry, there are no documents available for this product.
Catalogues
-
Radiology-Quality-Assurance-EU-Version-1.5
Download (18.37 MB)